I am a lazy cloud architect with a background in site reliability engineering. That’s why I immediately felt in love with the idea behind CloudWatch Anomaly Detection when it was announced almost three years ago.
What is anomaly detection?
Regardless of the algorithm used to determine the outliers, anomaly detection is the process of discovering values that differ considerably from the majority of the data and should raise suspicions and alarms. The availability of a managed service, based on machine learning, that alerts a SRE if something goes wrong is too good to be ignored. CloudWatch Anomaly Detection is that option, without integrating third party tools or relying on more complex services like Amazon Lookout for Metrics.
Configuring CloudWatch Anomaly Detection
In a few seconds you can add an alarm that will help monitor even the simplest website. A service with a pricing that is not too high or complicated. What can go wrong with Anomaly Detection? Not too much. As long as you do not consider it a catch-all alarm replacing any other one you have configured in CloudWatch.
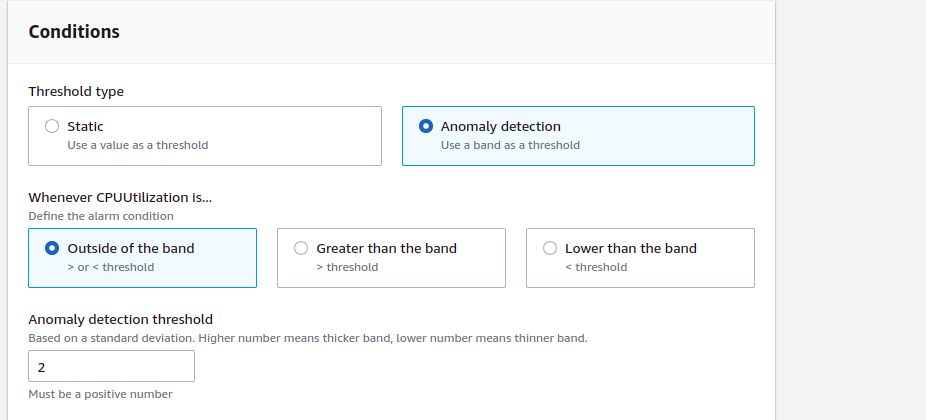
While the expected values represent normal metric behavior, the threshold of Anomaly Detection is based on standard deviation, as the label in the console suggests: “Based on a standard deviation. Higher number means thicker band, lower number means thinner band”.
The only not trivial step in the setup is deciding the threshold: what is a good number? Small with possibly many false alarms? High with the chance of missing some outliers? A bigger challenge is to remember that the algorithm cannot know the constraints of your system or the logic behind your product. Let’s give it a try.
Monitoring coconut orders
Let’s assume you have a successful website where you sell coconuts and you want to monitor the number of completed purchases per minute. You have thousands of orders at peak time, a few hundreds during the night with some daily and weekly patterns. Lucky you, that is many coconuts! How can you monitor the online shop? How do you adapt the alarms for seasonality and trend changes?

Without Anomaly Detection, you should have at least two static alarms in CloudWatch to catch the following cases:
- the “Zero Orders” scenario: it likely indicates that something is broken in the shop. A simple static alarm, catching zero values for the shortest sensible period will not raise many false positives.
- the “Black Friday” scenario: it is much harder to define a safe upper boundary but you can for example create an alarm at 130% of the maximum value you achieved in the previous month.
Falling coconuts
None of these two static alarms helps if the orders fall by half during the day or if the pattern suddenly changes and you lose 30% of your daily orders. You still do not account for seasonality but these static alarms are better than no monitoring.
Here comes CloudWatch Anomaly Detection: with a few clicks, you can configure an alarm and be notified when the pattern of the orders changes.
Can you simply configure the smart alarm, discard the static ones and trust the magic of machine learning? Let’s take a step back and look at one of the very first presentations of Anomaly Detection.
The example used to highlight the seasonality and the benefits of the new option shows a range band – regardless of how many standard deviations – with negative values. But the ConsumedWriteCapacityUnits metric cannot be negative. A subpar example?
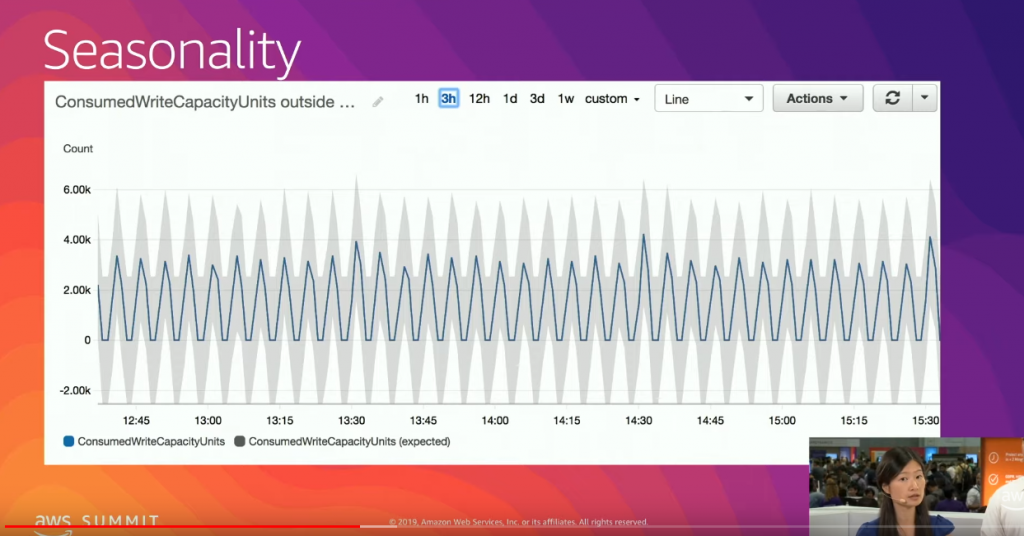
Going below zero
The ConsumedWriteCapacityUnits one is not a corner case. Most AWS and custom metrics have only positive values. Selecting randomly some metrics in the dashboard:
- you cannot have negative orders in the coconut (custom) metric
- you cannot have negative IOPS on RDS
- you cannot have a negative CPU or ACU for Aurora Serverless
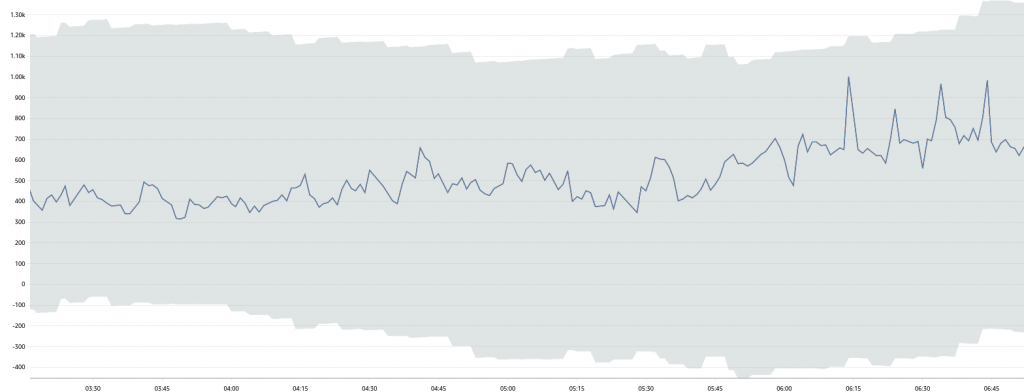
Considering 100s metrics, there are only a few that can occasionally go below zero. But the gray band in Anomaly Detection often does.
If you set up a static zero alarm as previously discussed, just keep it: one based on Anomaly Detection might not react as quickly as a static one. The ML option can help finding outliers but it is not the fastest way to catch a broken system with no orders.
For example, during the quieter hours, a “zero orders” scenario would not be immediately an outlier.
Ideally there should be a flag in CloudFront to enforce positive values. But only you know the pattern of your service and a strength of CloudWatch Anomaly Detection is the simple setup. It just works.
Let’s do a simple test to show the difference between constrained values and an algorithm based on machine learning. Let’s roll a dice.
Rolling a dice
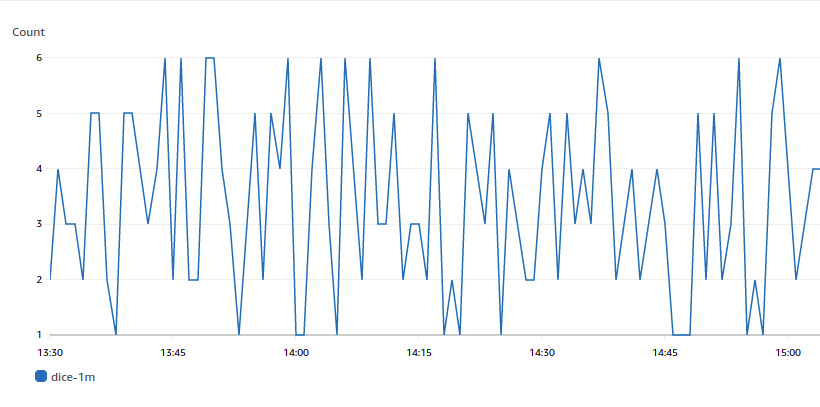
One dice, six faces, and numbers between 1 and 6. No pattern and no outliers. There are no 0s and no 7s, there are no values outside the fixed range when you roll a dice. But Anomaly Detection cannot know that.

How can we test it? Let’s roll a dice in CloudWatch with the AWS CLI and a one line bash script roll-a-dice:
aws cloudwatch put-metric-data --namespace "cloudiamo.com" --metric-name "dice-1m" --unit Count --value $(( $RANDOM % 6 + 1 ))
Adding the script to the crontab, we can have a new random value in CloudWatch every minute.
* * * * * /home/ubuntu/roll-a-dice
We now set up Anomaly Detection on the custom dice metric, wait a few days and see what the AWS algorithm thinks of the randomic pattern. How is it going to apply machine learning algorithms to the dice’s past data and create a model of the expected values?
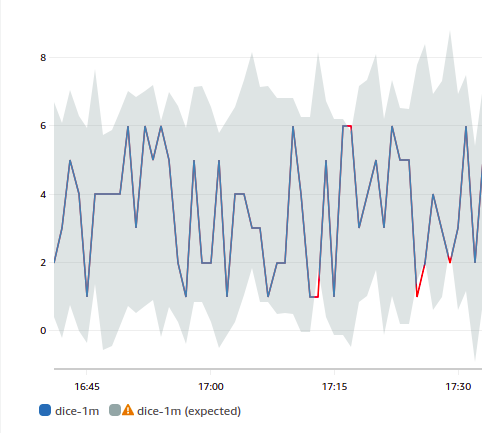
Anomaly Detection is doing a good job given the circumstances but a zero or a seven might not (immediately) trigger an alarm.
Rolling a dice is way too simple and it has no predictable patterns, but if you have hard boundaries in your values, you should have a separate static alarm for that. Relying only on Anomaly Detection is suboptimal. Let’s now challenge CloudWatch and the AWS algorithm with something more complicated, a skyline.
Drawing the NYC skyline
Last year I presented a session at re:Invent, drawing the NYC skyline with Aurora Serverless v2. A SQL script triggered the spikes in the CPU and the Aurora Capacity Unit (ACU) of the serverless database, drawing a basic skyline of New York City in CloudWatch.
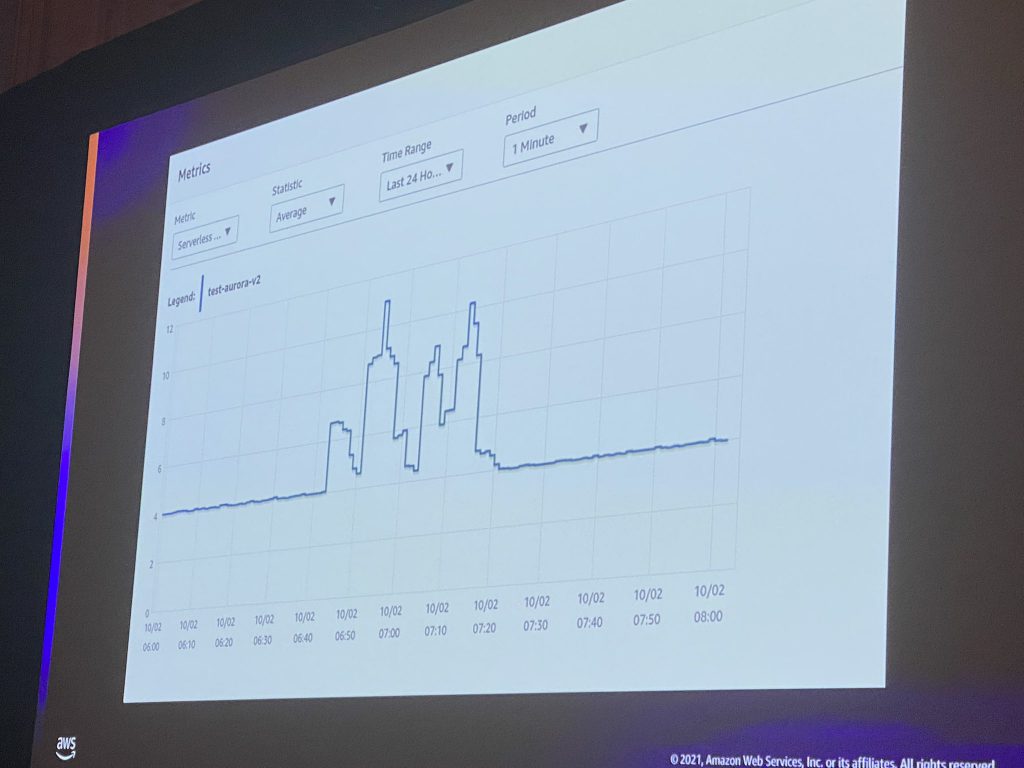
Let’s run that SQL script multiple times, for days, for weeks. Is CloudWatch Anomaly Detection going to forecast the NYC skyline?
Reusing the same logic from re:Invent, we can run it on a Aurora Serverless v2 endpoint, adding a 30 minutes sleep between executions and looping. This translates to a single bash command:
while true; do mysql -h nyc.cluster-cbnlqpz*****.eu-west-1.rds.amazonaws.com -u nyc < nyc.sql; sleep 1800; done;
Unfortunately, even after a couple of weeks, the range of Anomaly Detection is still not acceptable.
What is the problem here? A key sentence explains how the service works: “Anomaly detection algorithms account for the seasonality and trend changes of metrics. The seasonality changes could be hourly, daily, or weekly”.
Our loop has a fixed period but it is not hourly, daily or weekly. It is 30 minutes plus the execution of the SQL script. The data points at 7:47 UTC and 8:47 UTC are unrelated. The data points at 7:47 UTC on different days have nothing in common, we do not have a standard and supported seasonality.
But is this really the problem? Let’s change the approach slightly and run the SQL script hourly. It is a single line in the crontab:
0 * * * * mysql -h nyc2.cluster-cbnlqpz*****.eu-west-1.rds.amazonaws.com -u nyc < nyc.sql
Does the new period work better with Anomaly Detection? Let’s wait a few days and see the new forecasted range.
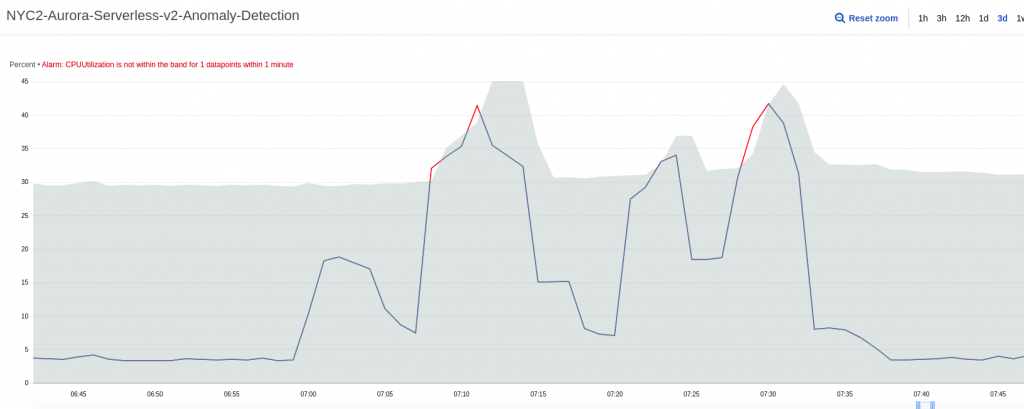
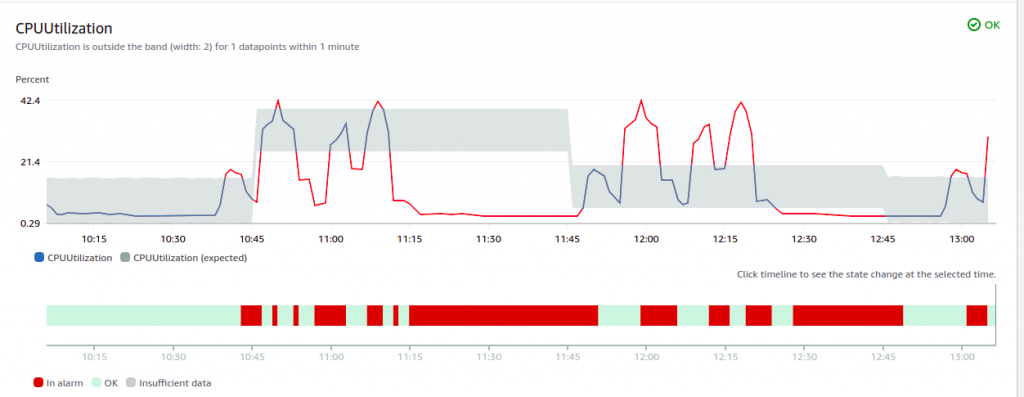
After a couple of days the overlap is still not perfect and the baseline for the CPU is generous but there is now a clear pattern. The outliers are not too different from the ones we saw with the coconuts.
If we suddenly change the crontab entry from hourly to every two hours, we notice that Anomaly Detection was indeed forecasting an hourly pattern.
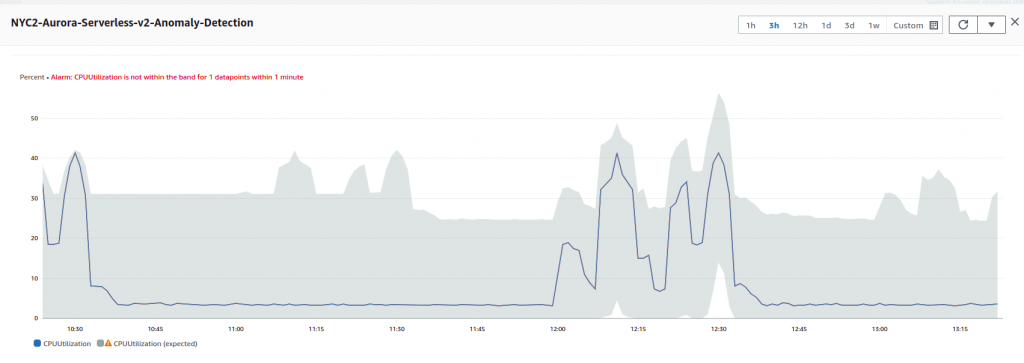
The seasonality of the data is a key element. A periodic pattern is not enough, an hourly, daily or weekly one is required.
Conclusions
What did we learn? Is it worth using CloudWatch Anomaly Detection?
- CloudWatch Anomaly Detection is easy to configure, almost free, and is a great addition to a monitoring setup. There are very few reasons not to use it.
- You should add Anomaly Detection to your existing static alarms in CloudWatch, not simply replace them.
- Make sure that your pattern is hourly, daily, or weekly.
- There is much more you can do going forward: Amazon CloudWatch now supports anomaly detection on metric math expressions.
- Take a look at Amazon Lookout for Metrics if you need a more powerful tool and are planning to automatically detect anomalies in business and operational data. Consider CloudWatch Application Insights if you need automated setup of observability for enterprise applications.
Thanks for making it this far! I am always looking for feedback to make it better, so please feel free to reach out to me via LinkedIn or email.
Credits
Coconut photo by Tijana Drndarski and dice photo by Riho Kroll. Re:Invent photo by Goran Opacic. All other photos and screenshots by the author. The AWS bill for running these tests was approximately 120 USD, mainly ACU for Aurora Serverless. Thanks AWS for the credits. Thanks to Stefano Nichele for some useful discussions about the benefits and challenges of CloudWatch Anomaly Detection.